English | MP4 | AVC 1280×720 | AAC 44KHz 2ch | 145 lectures (17h 22m) | 9.11 GB
D3.js (V 5) from Scratch! Build Useful D3.js Data Visualization Projects! D3.js for Beginners
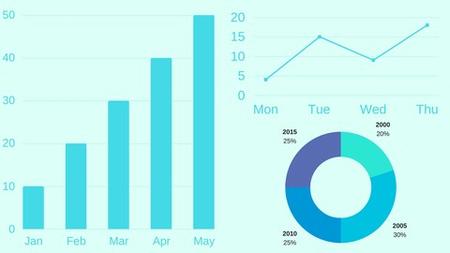
“A picture is worth a thousand words”. It is true that concepts are easily understood when explained with the help of diagrams. In today’s data-driven world, it is very important to make the best use of available data in such a way that useful insights are derived from it. Data visualization is the easiest and fastest way to make it possible. D3.js is a popular JavaScript library for manipulating documents in the context of data data. D3 stands for Data Driven Documents. D3 helps you bring data to life using HTML, SVG, and CSS.
D3 allows you to bind data to a Document Object Model, and then apply data-driven transformations to the document. Elements can be added, removed, or modified according to the contents of the data set. For example, you can use D3 to generate an HTML table from an array of numbers or even use the same data to create a horizontal bar chart using SVG. D3 combines powerful visualization and interaction techniques with a data-driven approach to DOM manipulation.
“D3.js in Action: Build 17 D3.js Data Visualization Projects” is a 100% practical hands-on course that teaches you D3.js from scratch using the latest available version V5. All concepts are explained in a very detailed and easily understandable manner. The instructor codes along instead of explaining the concepts with already prepared code samples. By completing this course, you will be confident enough to develop D3.js Data Visualizations on your own from scratch.
As of now, there are 17 projects included in this course that are developed from scratch. This will help you really boost your confidence in applying your D3.js knowledge to develop real-world data visualization projects. The projects developed as part of this course are:
- Horizontal Bar Chart
- Vertical Bar Chart
- Vertical Bar Chart with Axes
- Scatterplot
- Line Chart
- Area Chart
- Stacked Area Chart
- Pie Chart with Legend
- Animated Bar Chart
- Moving Stars
- Make Me Laugh
- Family Tree
- Classic Family Tree
- Tree with Images
- Complete Family Tree
- Zoomable Family Tree
- Ancestry Chart
So join this wonderful D3.js course and have a great time learning D3.js (V5).
Table of Contents
Be Familiar with D3js Introduction to D3js
What is D3js
General Instructions to Follow
What Software You Need
Primer on Technology Fundamentals D3js Prerequisites
CSS Selectors Part 1
Source Code CSS Selectors Part 1
CSS Selectors Part 2
Source Code CSS Selectors Part 2
SVG Basics Part 1
Source Code SVG Basics Part 1
SVG Basics Part 2
Source Code SVG Basics Part 2
SVG Basics Part 3
Source Code SVG Basics Part 3
Be Ready to Start Basics of D3js
Source Code Set Up D3js Development Environment
Select the Required Elements Part 1
Source Code Select the Required Elements Part 1
Select the Required Elements Part 2
Source Code Select the Required Elements Part 2
Style the Selected Elements
Source Code Style the Selected Elements
Add Class to the Selected Elements
Source Code Add Class to the Selected Elements
Set Attributes to the Selected Elements
Source Code Set Attributes to the Selected Elements
Set Content for the Selected Elements
Source Code Set Content for the Selected Elements
Add New Elements
Source Code Add New Elements
HandsOn Create SVG on the Fly
Source Code HandsOn Create SVG on the Fly
D3js Data Joins The Core of D3js
Join an Array of Data with Selected Elements
Source Code Join an Array of Data with Selected Elements
Join an Array of Objects with Selected Elements
Source Code Join an Array of Objects with Selected Elements
Introduction to Data Joins The Core of D3js
Enter Update and Exit Selections in Version 3
Source Code Enter Update and Exit Selections in Version 3
Enter Update and Exit Selections in Version 5
Source Code Enter Update and Exit Selections in Version 5
The Real Magic of D3
Source Code The Real Magic of D3
Project 1 Horizontal Bar Chart
Project 2 Vertical Bar Chart
Adjust the Size Up or Down D3js Scales
Introduction to Scales in D3js
Linear Scales
Source Code Linear Scales
Avoid Hardcoding with min and max
Source Code Avoid Hardcoding with min and max
Color Scales
Source Code Color Scales
Power and Logarithmic Scales
Source Code Power and Logarithmic Scales
Time Scales Part 1
Time Scales Part 2
Source Code Time Scales
Sequential Scales
Source Code Sequential Scales
Quantize Scales
Quantile Threshold Scales
Source Code Quantize Quantile Threshold Scales
Ordinal Scales
Source Code Ordinal Scales
Have an Axis for Reference D3js Axes
Add X and Y Axis
Source Code Add X and Y Axis
Style the Axis as You Want Part 1
Style the Axis as You Want Part 2 Update to Part 1
Source Code Style the Axis as You Want
HandsOn Display 4 Axes Based on User Input Part 1
HandsOn Display 4 Axes Based on User Input Part 2
HandsOn Display 4 Axes Based on User Input Part 3 Update Lecture
Source Code HandsOn Display 4 Axes Based on User Input
Project 3 Vertical Bar Chart with Axes Part 1
Project 3 Vertical Bar Chart with Axes Part 2 Update to Part 1
Project 4 Scatterplot
Draw Different Shapes D3js Shapes
Line Generator Part 1
Line Generator Part 2
Source Code Line Generator
Project 5 Line Chart Part 1
Project 5 Line Chart Part 2 Update to Part 1
Area Generator
Source Code Area Generator
Project 6 Area Chart Part 1
Project 6 Area Chart Part 2
Stack Generator
Source Code Stack Generator
Project 7 Stacked Area Chart Part 1
Project 7 Stacked Area Chart Part 2
Project 7 Stacked Area Chart Part 3
Arc Generator Part 1
Source Code Arc Generator Part 1
Arc Generator Part 2
Source Code Arc Generator Part 2
Arc Generator Part 3
Source Code Arc Generator Part 3
Pie Generator
Source Code Pie Generator
Symbol Generator
Source Code Symbol Generator
Project 8 Pie Chart with Legend Part 1
Project 8 Pie Chart with Legend Part 2
Animate Your Visualizations D3js Transitions
Introduction to Transitions
Source Code Introduction to Transitions
Control the Speed of Your Animations
Source Code Control the Speed of Your Animations
Project 9 Animated Bar Chart
Transition Chaining
Source Code Transition Chaining
Tweening
Source Code Tweening
Project 10 Moving Stars
Project 11 Make Me Laugh Part 1
Project 11 Make Me Laugh Part 2
Make Your Visualizations Interactive Dragging and Zooming
Interact using Mouse Part 1
Interact using Mouse Part 2
Source Code Interact using Mouse
Make Visualizations Draggable
Source Code Make Visualizations Draggable
Zoom In and Zoom Out Visualization at Individual Level
Source Code Zoom In and Zoom Out Visualization at Individual Level
Zoom In and Zoom Out Visualization as a Whole
Source Code Zoom In and Zoom Out Visualization as a Whole
Deal with External Data in Different Formats
How to Fetch and Process CSV Data
How to Fetch and Process JSON Data
How to Fetch and Process XML Data
Create More Advanced Visualisations D3js Layouts
Introduction to Tree Layout Part 1
Introduction to Tree Layout Part 2
Source Code Introduction to Tree Layout
Tree in a Different Direction
Source Code Tree in a Different Direction
Project 12 Family Tree Part 1
Project 12 Family Tree Part 2
Solution to Name Conflict in Family Tree
Source Code Solution to Name Conflict in Family Tree
Project 13 Classic Family Tree Part 1
Project 13 Classic Family Tree Part 2
Project 13 Classic Family Tree Part 3
Project 14 Tree with Images
Project 15 Complete Family Tree
Project 16 Zoomable Family Tree
Project 17 Ancestry Chart Part 1
Project 17 Ancestry Chart Part 2
Project 17 Ancestry Chart Part 3
Project 17 Ancestry Chart Part 4
BONUS Section
BONUS Lecture Special OFFER on Our Other Course
Resolve the captcha to access the links!